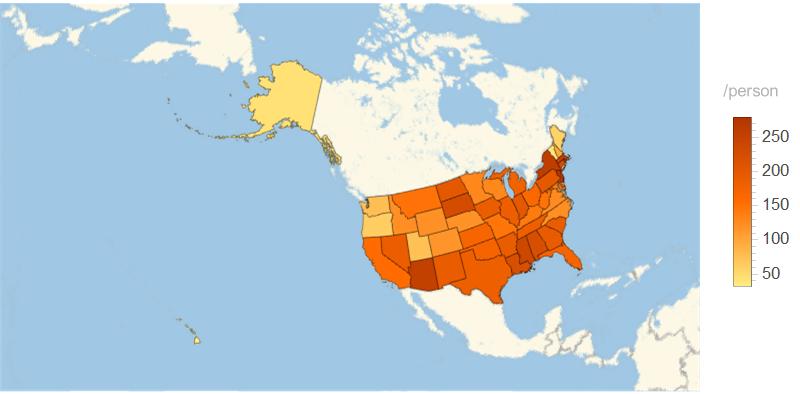
The week long Analyzing COVID-19 Data Study Group (6) covered the of analysis, visualization and modeling of COVID-19 pandemic data using various Wolfram COVID-19 resources, the NY Times COVID-19 Dataset, and a patient data set. The daily study sessions demonstrated techniques to analyze patient data, virus genetic sequences, and model the pandemic using epidemic data. The figure below shows the COVID-19 Death Rate per 100,000 people by state based on the April 11, 2021 update of the Epidemic Data for Novel Coronavirus COVID-19 dataset, for example.